Note
Click here to download the full example code
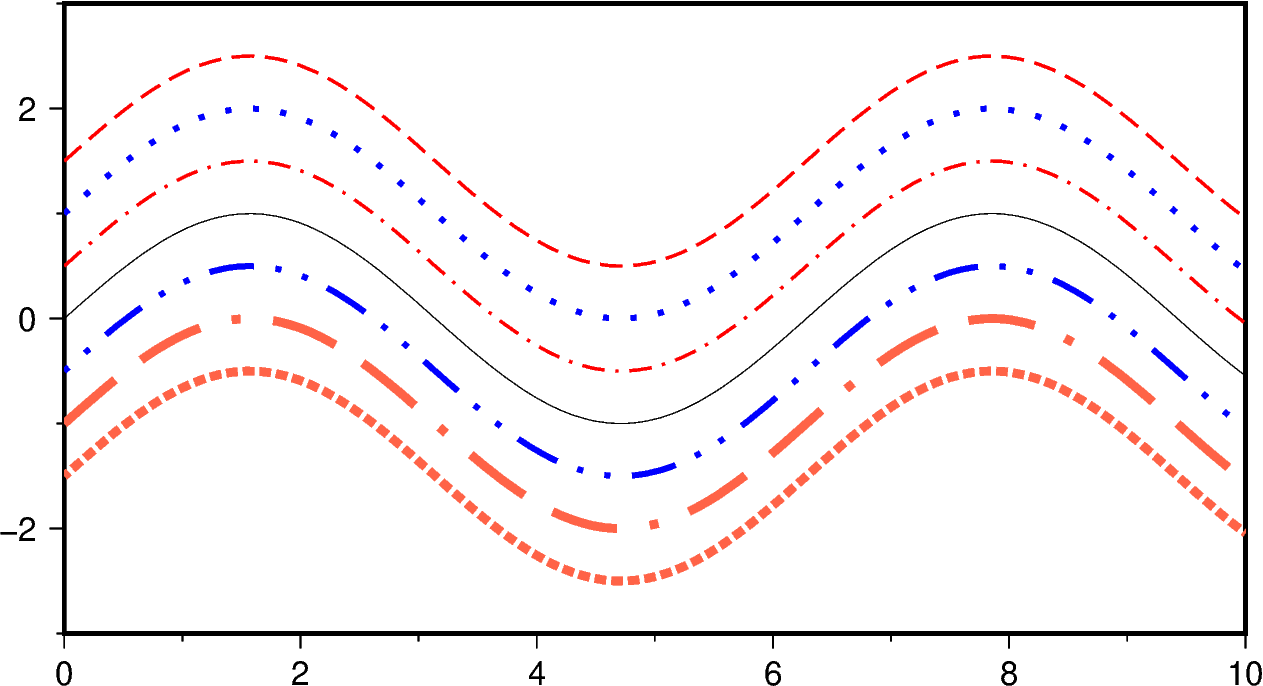
Line styles
The pygmt.Figure.plot method can plot lines in different styles.
The default line style is a 0.25-point wide, black, solid line, and can be
customized via the pen argument.
A pen in GMT has three attributes: width, color, and style. The style attribute controls the appearance of the line. Giving “dotted” or “.” yields a dotted line, whereas a dashed pen is requested with “dashed” or “-”. Also combinations of dots and dashes, like “.-” for a dot-dashed line, are allowed.
For more advanced pen attributes, see the GMT cookbook https://docs.generic-mapping-tools.org/latest/cookbook/features.html#wpen-attrib.
Out:
<IPython.core.display.Image object>
import numpy as np
import pygmt

# Generate a sample line for plotting
x = np.linspace(0, 10, 500)
y = np.sin(x)

fig = pygmt.Figure()
fig.basemap(region=[0, 10, -3, 3], projection="X15c/8c", frame=["xaf", "yaf", "WSrt"])

# Plot the line using the default line style
fig.plot(x=x, y=y)

# Plot the lines using different line styles
fig.plot(x=x, y=y + 1.5, pen="1p,red,-")
fig.plot(x=x, y=y + 1.0, pen="2p,blue,.")
fig.plot(x=x, y=y + 0.5, pen="1p,red,-.")

fig.plot(x=x, y=y - 0.5, pen="2p,blue,..-")
fig.plot(x=x, y=y - 1.0, pen="3p,tomato,--.")
fig.plot(x=x, y=y - 1.5, pen="3p,tomato,4_2:2p")

fig.show()
Total running time of the script: ( 0 minutes 0.535 seconds)